Research And Development
![]()
What is it?
It is a web and mobile application that provides vocational guidance for career decision making, based on skills, interests, and information about the labor market and geographical location of users.
How it works?
Users should answer quick and fun questions that are used by a statistical system, which displays results based on their answers. It suggests them their most convenient career fields and the information mentioned above.
My contribution
I proposed improvements in the type and quality of data that was going to be showed, forms of visualization and interaction. I also created part of the project graphic material and was in charge of serving customers.
Type of results
They are divided into the following sections: 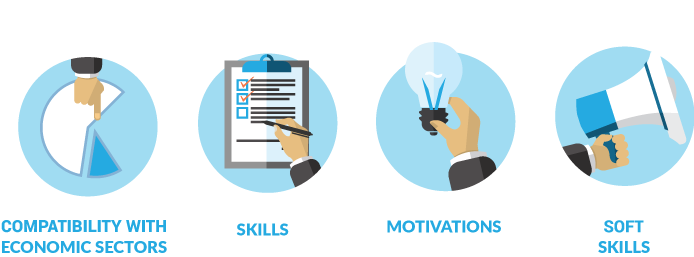
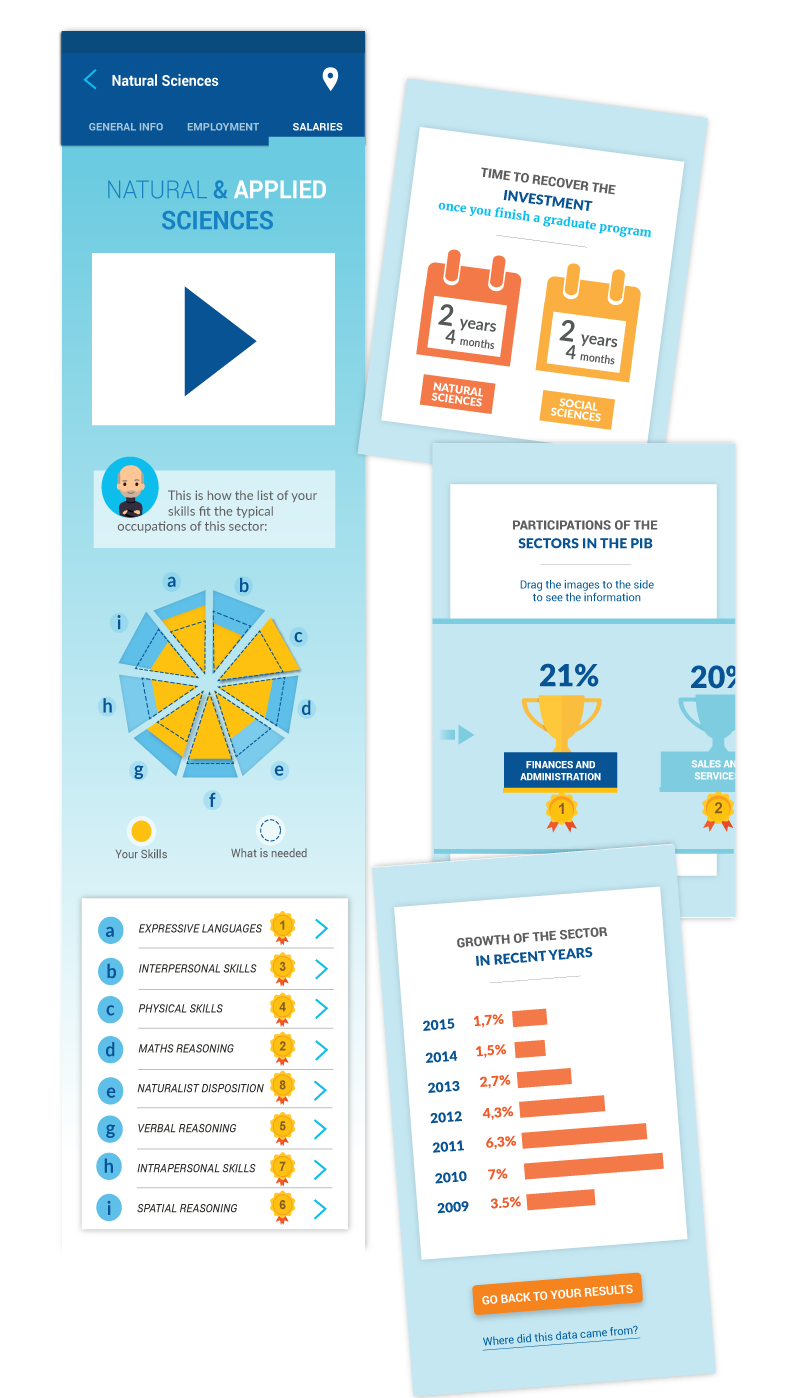
Here there is showed part of the “Compatibility with the economic sector” menu. Which shows information about salaries, employment and general characteristic of each sector.
Subsections
(Of the Compatibility with Economic Sectors Menu)
Salaries Section
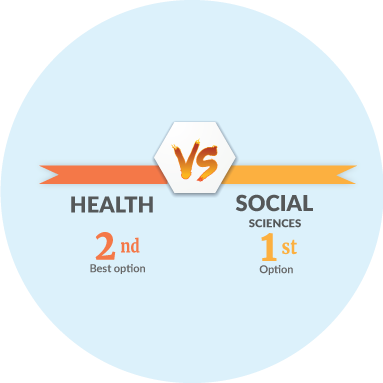
In order to have a comparison point, every time one selects a sector to explore, the application compares it with the best option of each user using two distinctive colors.
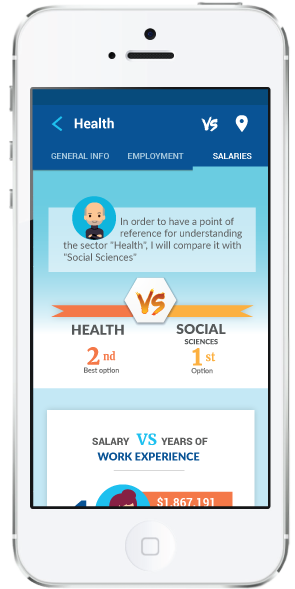
Design objective
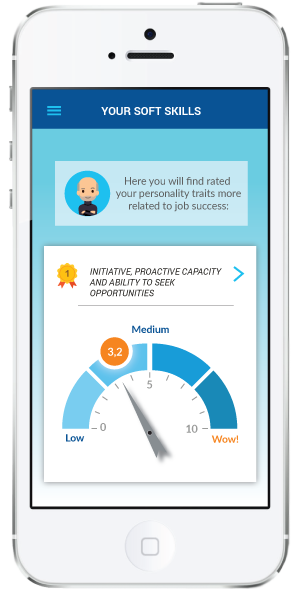
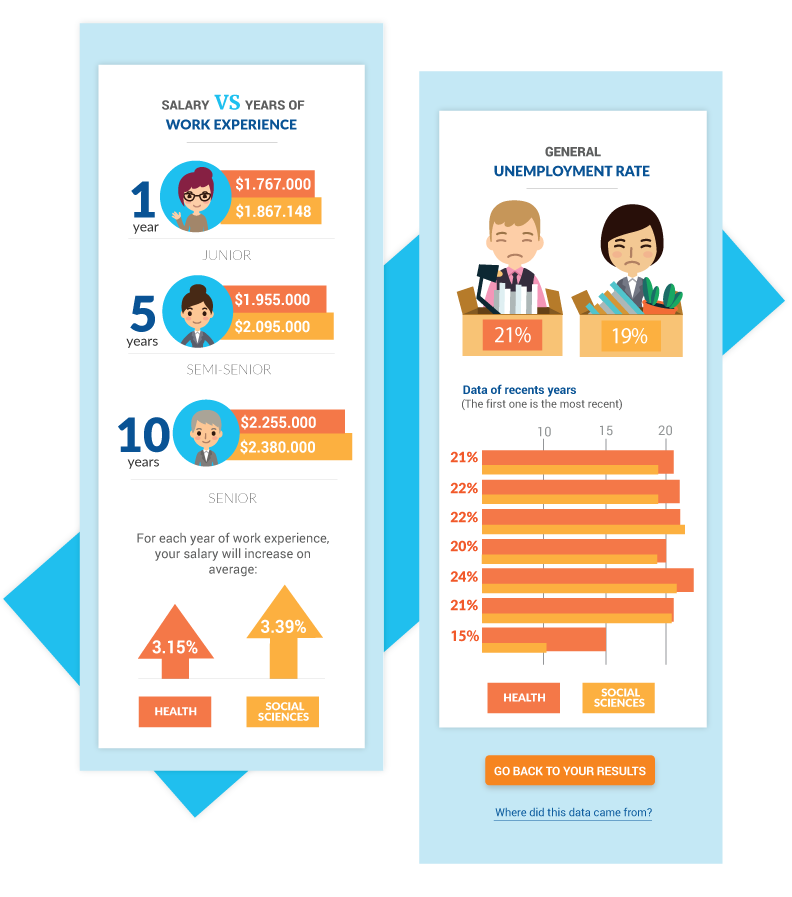
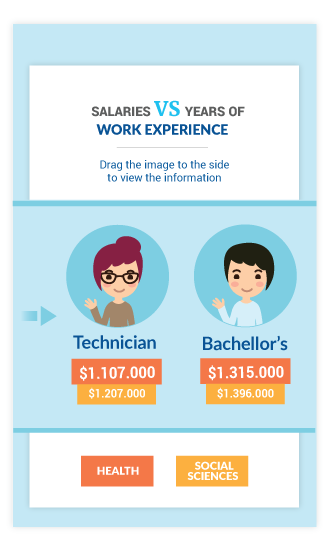
The aim was to show statistical data, in an entertaining and clear way striking to undergraduate student. It was done using numbers and visual information as well as images.
In some cases the boxes that contain numerical data, have a widht that corresponds to its corresponding number, in order to offer the users alternative ways to understand the information.
General info